The average website converts only about 2% to 3% of visitors, which means roughly 97% to 98% leave without doing what you wanted them to do, so the question in CRO isn’t whether you need more traffic, it’s where the leak is and how fast you can plug it. That’s why how to improve conversion rates is usually a problem of efficiency, not volume. If a site moves from 2% to 3% conversion, that’s a 50% relative increase in completed actions without spending another dollar on traffic, and the same logic applies across sign-ups, demos, checkout, and expansion flows. Source on the 2% to 3% baseline and conversion formula
Start with a funnel mindset, because the same visitor volume can produce very different outcomes depending on clarity, speed, and friction. The practical shift is simple, define the conversion that matters, measure the current baseline, then work the highest-drop-off step first.
Practical rule: if you can’t name the exact conversion event, the segment, and the baseline, you’re not doing CRO yet, you’re just changing pages.
Why Conversion Rate Optimization Is a Systems Problem
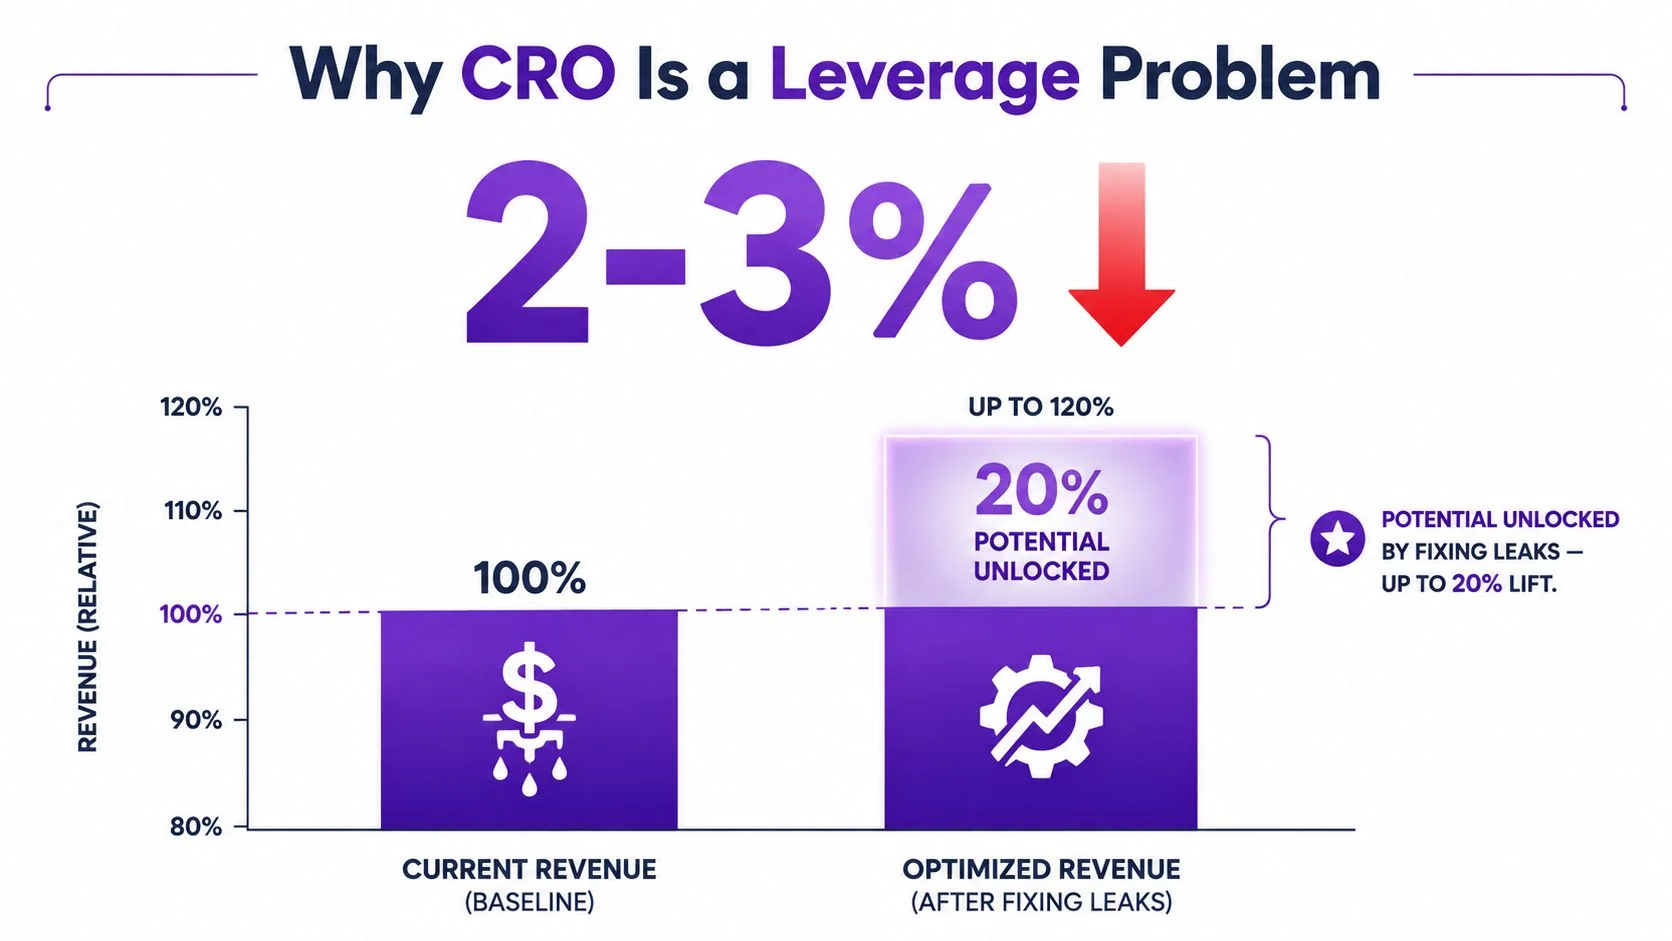
A site can have steady traffic and still miss its number because the funnel leaks at different points for different reasons. A signup page may confuse first-time visitors, a pricing page may create hesitation, a demo request form may ask for too much, and a help article may be the place where buyers go to answer the question that blocks them from converting. That is why conversion rate optimization works best as a system problem, not a page decoration exercise.
Start with the conversion event that actually matters
A primary conversion event should change with the funnel stage. For SaaS, that might mean trial sign-up, activation, paid conversion, or expansion. For e-commerce, it could be add-to-cart, checkout start, or purchase completion. If product, analytics, and growth teams do not agree on the event, every experiment gets harder to read and easier to argue about.
The cleanest setup is a short internal spec for each funnel step, with the goal, baseline, segment, and success threshold written in one place. That keeps teams from celebrating a blended lift that hides a mobile problem, a geography-specific drop-off, or a weak handoff from a knowledge base article into the next action. The formula itself is straightforward, conversions divided by total visitors, multiplied by 100, but the discipline is in agreeing on what counts as a conversion before anyone touches the page.
Segment before you optimize
Blended metrics are useful only if they lead to the next question. A site can look healthy overall while mobile users stall, paid traffic bounces, or a specific user role never gets through the flow. That is why I always segment by traffic source, device type, user role, and geography before making a judgment.
A strong baseline template looks like this:
| Field | What to capture |
|---|---|
| Goal | The exact conversion event |
| Baseline | Current conversion rate for that event |
| Segment | Source, device, user type, geography |
| Threshold | The lift that would justify a rollout |
The point is not more reporting. It is deciding where to focus. As noted in the baseline guidance as outlined in the conversion-rate baseline guidance, a single average can hide very different experiences, and your highest-return work usually lives in the worst-performing segment, not the biggest one.
Use a four-phase lens, not a random checklist
The strongest CRO programs follow a simple sequence, diagnose, prioritize, experiment, scale. Diagnose tells you where the leak is. Prioritize keeps the backlog honest. Experiment proves causality. Scale locks the gain into the product and the process.
That sequence matters because traffic growth and conversion growth behave differently. Traffic adds more visitors, but optimization improves the value of each visitor you already paid to acquire. In practice, that means the same landing page, the same media spend, and the same sales motion can produce more outcomes once friction is lower and the next action is clearer.
The teams that move fastest do not start by asking what looks worth testing. They ask which funnel step is leaking enough volume to matter, then use session recordings, knowledge-base entry points, localized content, and a close look at onboarding paths to see where the handoff breaks. If a demo request is stalling in one market, a re-timed multilingual demo video may matter more than a new headline. If buyers keep opening a help article before converting, that article is part of the funnel and should be treated like one, the same way the funnel analysis for eCommerce brands resource frames exit behavior as a signal, not a mystery. For teams that need a practical bridge from diagnosis to product changes, this guide to improving the customer onboarding process helps connect the friction in the funnel to the fix.
Diagnose Drop-Offs with Funnel Analytics and Qualitative Evidence
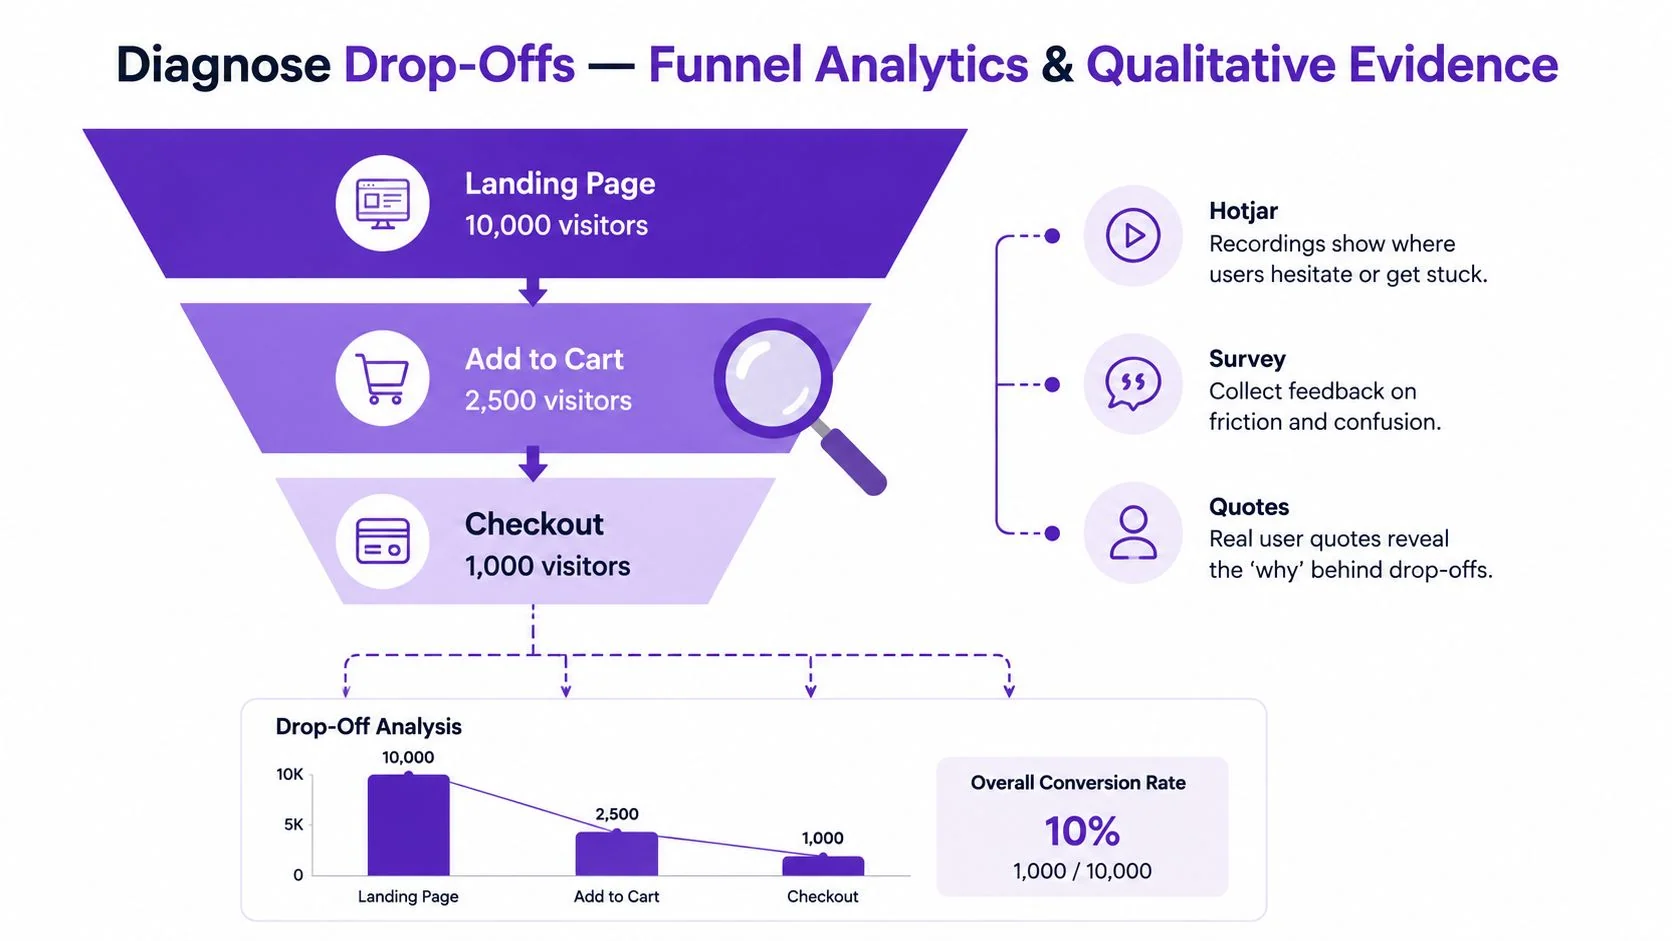
Start with funnel analytics, because it tells you where the biggest absolute drop is, not just where the loudest opinion lives. Rank each step by abandonment, then inspect the highest-traffic, lowest-converting pages first. That gives you the best odds of moving the number without chasing minor issues on low-volume screens.
Pair the numbers with the reason
Once the leak is identified, layer in qualitative evidence. Heatmaps and scroll depth show where attention stops. Session recordings show hesitation, confusion, repeated clicks, and dead ends. Short user interviews, or even a targeted survey on the page, can tell you why people backed out.
A useful pattern is to match one quantitative signal with one qualitative method:
- High drop-off on a page, pair it with session recordings to watch actual behavior.
- Low scroll depth, pair it with heatmaps to see what was ignored.
- Form abandonment, pair it with field-level analytics and error review.
- Late-stage hesitation, pair it with a one-question exit survey.
The diagnostic habit is more important than the tool stack. For a practical walkthrough of funnel-stage issues in commerce, the funnel analysis for eCommerce brands resource is a useful companion because it keeps the focus on where users exit, not where the team hopes the problem lives.
Don’t ignore traffic quality
A lot of teams optimize the wrong screen because the traffic itself is misaligned. Product marketing may be promising one thing while the landing page emphasizes another. Presales may be sending prospects to a knowledge-base article that answers a different question than the one the buyer had. In those cases, the page isn’t the core problem, the entry point is.
That’s why recording-based evidence matters so much. It shows whether users are confused by the page or arriving with the wrong intent. If the source is off, even a beautiful page can convert poorly because it’s solving the wrong problem.
The fastest way to waste a CRO cycle is to fix copy on a page that’s receiving the wrong audience.
For teams that need a process-specific example, the internal guide on how to improve customer onboarding process is a good reference point for mapping friction across early activation steps.
The best diagnostic stack isn’t complicated. It’s disciplined. Funnel data tells you where users leave, recordings tell you what they did, and surveys or interviews tell you what they were trying to do in the first place.
Prioritize Hypotheses So You Test What Will Move the Number
A backlog of ideas is not a strategy. Too many teams collect hypotheses faster than they can rank them, and low-value tests end up taking slots from the work that would move revenue. A lightweight ICE framework, Impact, Confidence, Ease, gives you a practical way to score ideas against the size of the leak you found.
Turn observations into testable hypotheses
A good hypothesis is specific enough that a result can prove it right or wrong. Write it in a form like this, Because we observed X, we believe changing Y for segment Z will improve metric M. If you cannot name the segment or the metric, the idea is probably still too vague to test.
Here’s a simple template you can use for scoring:
| Hypothesis | Impact (1-5) | Confidence (1-5) | Ease (1-5) | ICE Score | Segment |
|---|---|---|---|---|---|
| Simplify the form on mobile | Mobile prospects | ||||
| Rewrite the headline for demo traffic | Paid search | ||||
| Move trust proof closer to CTA | Pricing-page visitors |
Impact should reflect the size of the drop-off and the traffic affected. Confidence should reflect how much evidence you have from recordings, heatmaps, support comments, session replays, and entry-point patterns such as knowledge-base visits or localized demo pages. Ease should reflect implementation cost, not just design effort.
Use qualitative checks before engineering time
A five-user hallway test can save a sprint. A recorded walkthrough with a product manager or support lead watching the same session replays you watched can do the same. If multiple people see the same hesitation point, the hypothesis gets stronger. If they disagree on what users are confused about, the test is probably premature.
Many teams overfit to a single click pattern or comment. The point is not to find the cleverest test, it is to identify the simplest change that plausibly removes the friction you already observed. That often includes fixing the wrong entry point, not just the page itself, or adjusting localized content, including re-timed multilingual demo videos, when the problem shows up in specific markets rather than across the whole funnel. The internal guide on how to make product demo videos is useful here when you need to test whether better product framing can clear a known objection.
Choose the Right Experiment Type for the Hypothesis
Not every CRO question deserves a full-scale experiment. The wrong test type can waste time, create ambiguous results, or answer the wrong question with impressive-looking data. Match the method to the uncertainty you’re trying to remove.
Use the smallest test that can answer the question
An A/B test works well when the change is easy to isolate, such as a button label, CTA placement, or page flow. A UX test is better when you’re validating navigation, hierarchy, or checkout structure, because the issue is often about comprehension rather than wording. A copy test fits headlines, subheads, and microcopy. A pricing or offer test is appropriate when the question is about tier structure, packaging, or which value frame resonates.
A few concrete examples help:
- CTA color test on a pricing page, useful when the page has enough traffic and the question is whether the primary action stands out.
- Single-step versus multi-step checkout, useful when abandonment suggests the flow feels too heavy.
- Hero headline test on a SaaS landing page, useful when visitors don’t quickly understand the value.
- Pricing structure test, useful when the team wants to compare plan architecture while keeping the promise consistent.
The key discipline is to change one variable at a time whenever possible. If you change the headline, the button, and the layout in one go, the result may be useful commercially, but it won’t tell you which lever mattered.
Keep the test tied to the funnel leak
The best experiment type depends on where the funnel is leaking. If users are confused, test message clarity. If they hesitate at the form, test form length or structure. If they abandon late in checkout, test friction removal or trust signals. The test should answer the observed failure, not the team’s favorite theory.
For product teams building demo flows, the internal guide on how to make product demo videos is useful because a demo itself can be part of the conversion path, not just a marketing asset. When a demo is part of the decision, the experiment should reflect that reality.
If the hypothesis can’t be stated in one sentence, it’s usually too broad to test cleanly.
The goal is not to run more experiments. It’s to run the right one first, with the cleanest possible interpretation.
Run the Test, Read the Results, and Avoid False Wins
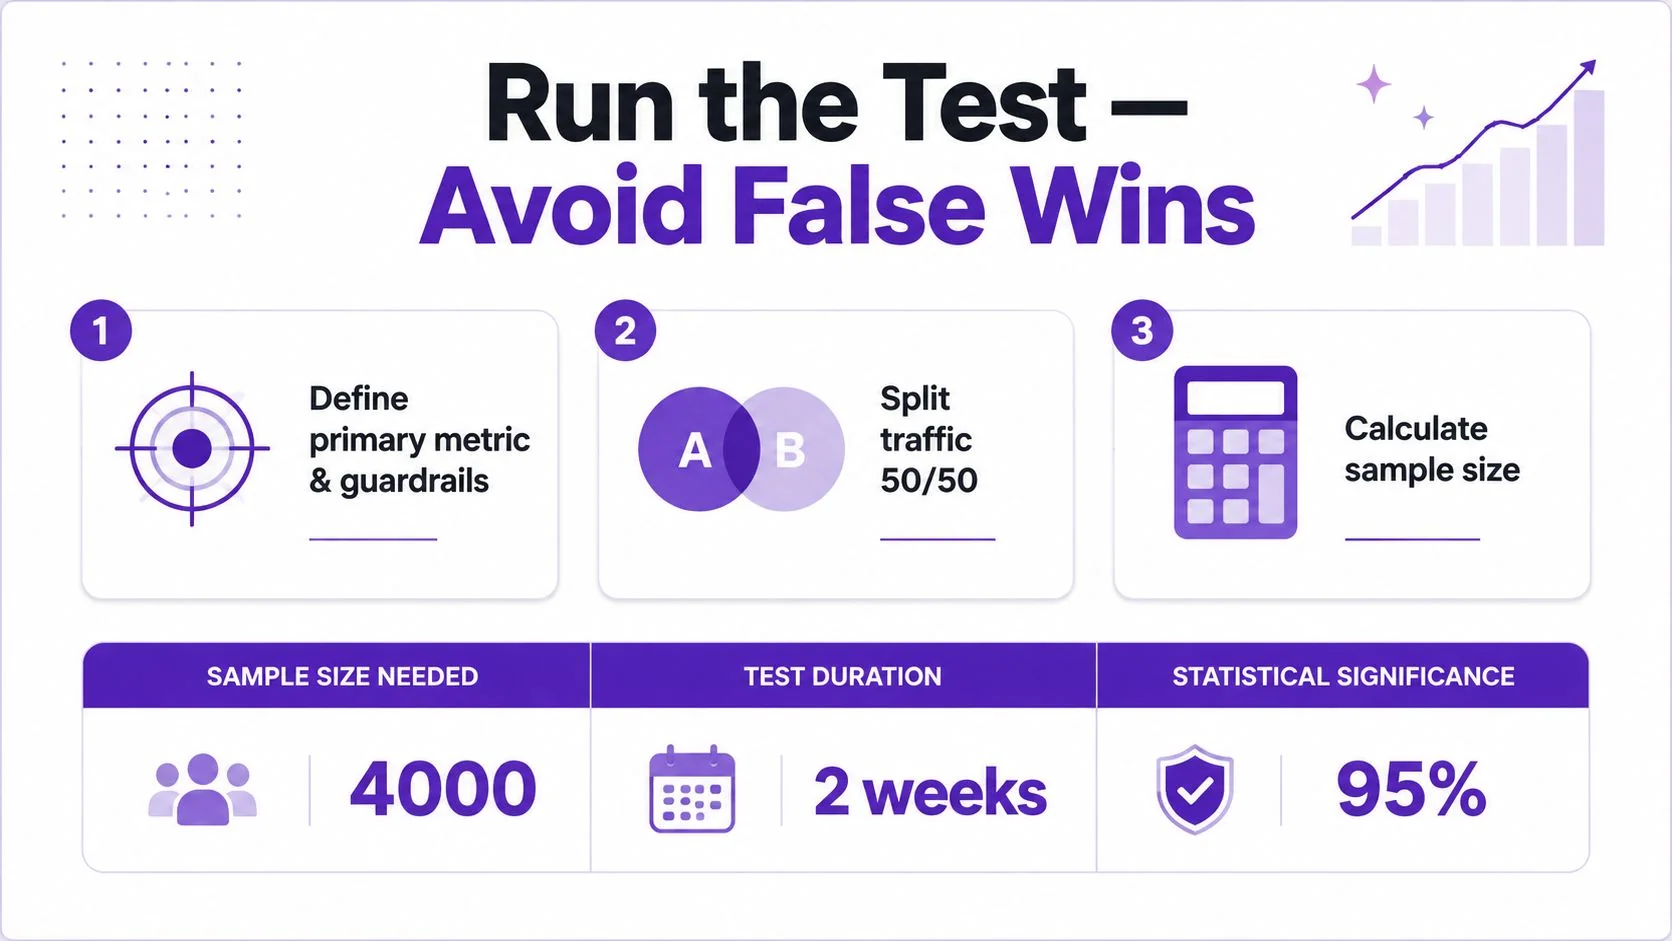
A test only helps if the setup is clean. If you stop too early, split traffic unevenly, or trust a weak sample, you can ship a lucky result that doesn’t hold up in production. The mechanics matter because false wins are expensive.
Set the guardrails before launch
Define one primary metric and a small set of guardrails. Split traffic evenly between control and variant. Run the test long enough to capture weekday and weekend behavior, which usually means at least two business cycles rather than a quick glance at early numbers. Practical optimization guidance recommends 95% confidence and more than 1,000 conversions per variant before trusting the result, which helps reduce the chance of overfitting as noted in Ryze’s testing guidance.
Speed and discipline have to coexist. Teams are often tempted to end a test when the variant looks better after a few days. That’s how weekly seasonality and small-sample noise create misleading confidence.
Read the result by segment, not just overall
A flat blended lift can hide a device-specific regression. Desktop may improve while mobile slips, or paid search may respond differently than organic traffic. That’s why the earlier segmentation work matters here. If you don’t break the results down by source and device, you can roll out a “winner” that hurts the most important audience.
Document the test after it ends, not weeks later. Record what changed, why it changed, what won, and what should roll into production. That history compounds. The next person who wants to test a similar idea won’t have to rediscover the same lesson.
Keep the retro simple
A useful retrospective has four lines, nothing more:
- What was tested
- Why it was tested
- What happened
- What gets rolled forward
That keeps the focus on interpretation, not ceremony. The strongest teams build a library of outcomes that makes the next decision faster and cleaner.
Scale the Wins Across the Funnel, the Brand, and the Languages You Serve
A winning variant should do more than fix one page. It should become a reusable principle that gets applied to adjacent steps, copy systems, and documentation workflows. That’s how a one-off experiment becomes part of how the team ships.
Propagate the logic, not just the layout
If a pricing-page test wins because the value proposition is clearer, apply that same clarity to the demo request page, onboarding prompts, and support entry points. If a form simplification wins, use the same field discipline in customer setup and internal handoffs. The idea is to scale the underlying reason the test worked.
Design systems and copy guidelines matter. They stop the team from relearning the same lesson next quarter. A strong rollout also means checking adjacent surfaces, not just the exact winning screen. If users see a clearer path in one place but hit a muddled experience in the next, the gain won’t fully hold.
Make localization part of conversion, not a side project
A lot of broad CRO advice treats localization like a finishing step. That’s too late. If your audience moves across regions and devices, localized, re-timed, on-brand video and documentation are conversion levers because they reduce effort and confusion at the point of decision.
That’s where the internal guide on localization best practices fits naturally. The practical lesson is simple, if the winning message doesn’t survive translation, timing, and format changes, the test result hasn’t really scaled. The same logic applies to multilingual demo videos, knowledge-base articles, and onboarding walkthroughs.
A win that only works in one language or on one screen isn’t a finished win, it’s a partially tested one.
When product, support, and growth teams align the page, the video, and the help content, the user doesn’t have to re-interpret the experience at each touchpoint. That’s where conversion consistency starts to show up across the funnel.
Your CRO Playbook Checklist and 30/60/90 Rollout Plan
A useful CRO program starts with a short checklist, not a dashboard full of vanity metrics. Before launch, confirm that the goal is defined, the baseline is captured, the diagnostic coverage is complete, the hypothesis is specific, the sample-size plan is set, and the result documentation format is ready. If any of those are missing, the next experiment will be harder to trust.
The checklist that keeps teams honest
- Goal definition: Write the exact conversion event and the segment it applies to.
- Baseline capture: Record the current rate before changing the page.
- Diagnostic coverage: Use funnel analytics, recordings, heatmaps, and survey feedback where relevant.
- Hypothesis quality: Make the change, segment, and expected metric explicit.
- Sample-size plan: Decide the confidence threshold and minimum variant volume before launch.
- Result documentation: Store the test name, outcome, and rollout decision in one place.
A practical 30/60/90 rollout
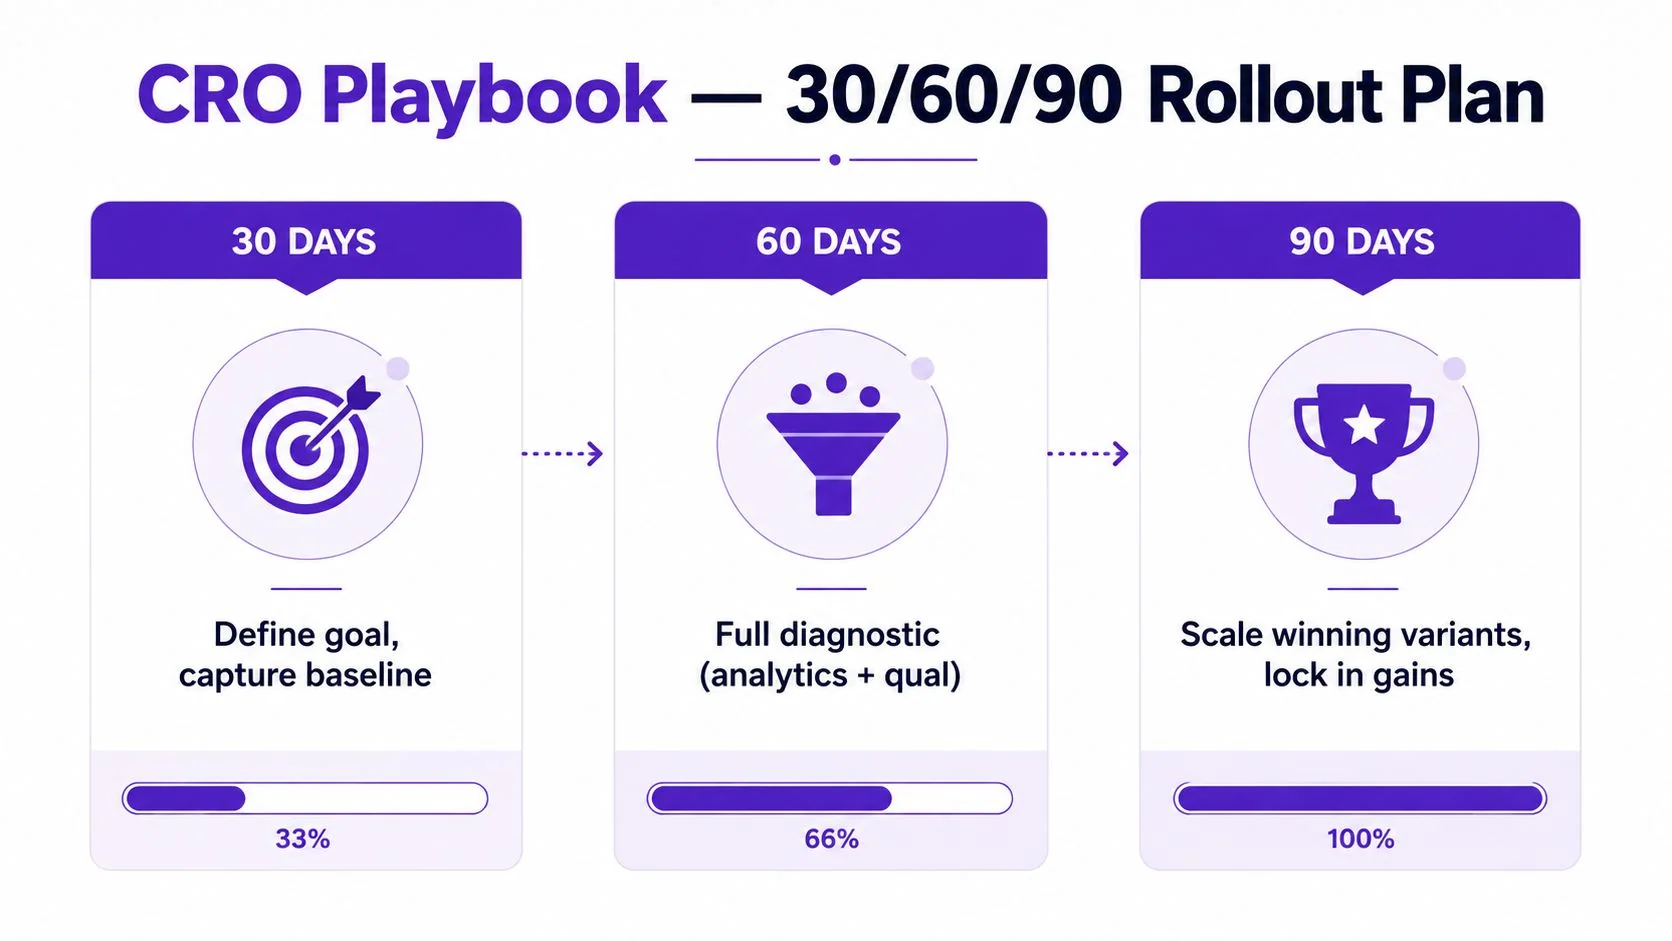
In the first 30 days, instrument the baseline and collect diagnostic evidence from the highest-drop-off step. In the next 30 days, launch the first two prioritized experiments and keep the scope tight enough to interpret. By day 90, ship the winner, propagate the principle across nearby surfaces, and queue the next cycle.
For teams working in commerce, the Sprints & Sneakers CRO guide is a solid reference because it reinforces the same pattern, diagnose the leak, test the smallest credible fix, then scale the learning. The value of the cadence isn’t just speed. It’s that every cycle makes the next one sharper.
The payoff comes when conversion work becomes routine. Once your team has a repeatable rhythm, the funnel gets easier to read, the backlog gets smaller, and the decisions stop depending on whichever opinion is loudest that week.
If you’re building tutorials, demos, onboarding flows, or help content to support your conversion work, visit Tutorial AI and see how one screen recording can become a polished video and a matching article in the same workflow. It’s a practical way to keep product education, support, and multilingual conversion paths consistent without dragging every update through a full editing cycle.