Learning and development metrics are your way of measuring what’s actually working. Think of them as the vital signs for your training programs. They go far beyond just checking who finished a course, digging into what people learned, how they're using their new skills, and the real impact on the business.
Why Learning and Development Metrics Matter Now
Let's be honest: L&D is no longer a "nice-to-have." In today's world, it's a strategic part of staying competitive. The biggest challenge we face as L&D professionals is proving our worth in a world that runs on data. This means shifting our focus from just tracking activity (like how many people clicked "complete") to measuring real, tangible business results.
Metrics are how we speak the language of the business. They turn training from a line item on a budget into a clear driver of value. When you can connect your L&D efforts to what the C-suite cares about, you’re not just justifying your budget—you’re telling a powerful story of impact.
The High Stakes of Inefficient Training
Companies are pouring money into developing their people, but every dollar is under the microscope. The numbers don't lie. A recent report showed organizations spent an average of $1,054 per employee on training. At the same time, the cost for each hour of learning shot up to $165—a staggering 34% jump from the year before.
Even with all that spending, the time employees spend in formal training is actually going down. You can check out the full report for more on these L&D spending trends. This all points to one thing: we have to be more efficient and prove our programs work.
Every training dollar has to count, and metrics are the only way to prove you’re getting a return on that investment. This is especially true for video training. Easy-to-use recording such as recording via Loom is often 50-100% longer than necessary, which kills engagement. On the flip side, professional video editing software such as Camtasia or Adobe Premiere Pro requires expert video editing knowledge.
This is exactly where Tutorial AI comes in. It helps your subject matter experts create polished video tutorials—think demos, onboarding videos, explainer videos, feature release videos, knowledge base videos, and support article videos—just by recording their screen. Tutorial AI's tools let you speak freely without any practice and still your video will look professional as if it was edited in Adobe Premiere Pro. It allows the subject matter expert to create on-brand videos extremely efficiently.
Ultimately, understanding how well your L&D programs are doing is a core piece of your overall human resource analytics and shows the value your team brings to the entire company.
Of course, none of this works without a solid plan. A well-defined learning and development strategy is the bedrock of any good measurement system. If you need a refresher, our guide on building an effective L&D strategy is a great place to start.
A Framework for Measuring Training Effectiveness
To measure the real impact of your L&D efforts, you can't just grab a bunch of random data points and hope they tell a story. You need a structured approach—a framework that connects the dots from how an employee felt about a course all the way to bottom-line business results.
For decades, the most trusted and battle-tested framework for this has been the Kirkpatrick Model. It’s a four-level model that gives you a clear roadmap for evaluating any training program, from a simple compliance module to a complex leadership series.
Think of it like building a house. You wouldn't start with the roof, right? You have to lay a solid foundation first. The Kirkpatrick Model works the same way. Each level builds on the one before it, giving you a complete, holistic picture of your training's success. This is how you move beyond simple "smile sheets" to measure genuine behavioral change and, ultimately, business impact.
This diagram shows perfectly how L&D initiatives should always flow from high-level business goals down to the specific metrics that prove their value.
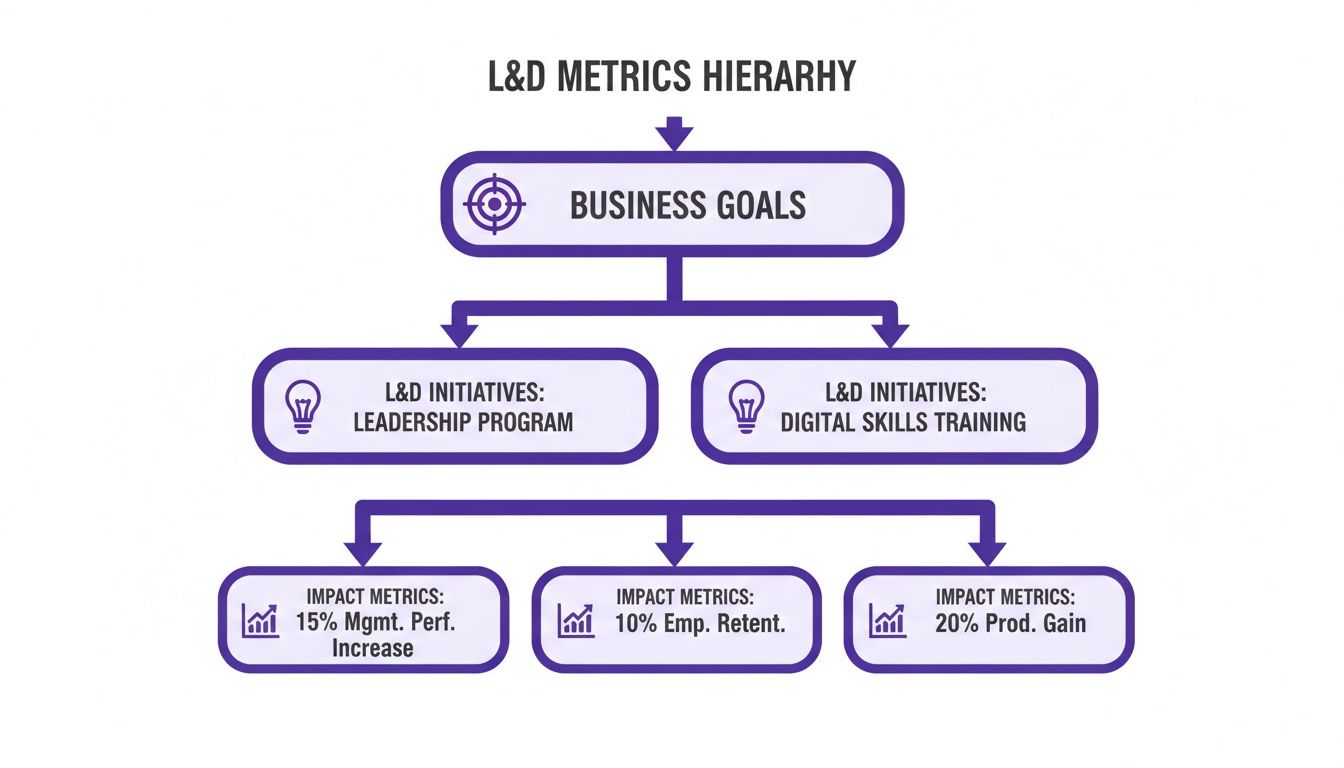
As you can see, every single training program—whether it's for leadership or digital skills—has to trace its roots back to a core business objective. Otherwise, why are you doing it?
Let's break down the four levels.
Level 1: Reaction
The first level is all about Reaction. This is where you measure how your participants felt about the training. Did they find it engaging? Was the content relevant to their job? Was the instructor any good? This is your classic feedback form data, usually gathered right after a session ends.
While it's the easiest level to measure, don't write it off. A wave of negative reactions is a huge red flag. It tells you something is wrong with the content or delivery, which means learning is unlikely to even happen in the first place.
Analogy: Imagine your company just rolled out a new software platform. Level 1 is the pop-up survey after the training asking, "How easy was that to follow?" It’s an immediate gut check.
Level 2: Learning
Next up is Learning. This level gets more specific, assessing whether your employees actually gained new knowledge, skills, or even confidence. Did they absorb the information? This is where you move past feelings and start measuring what they now know.
Common ways to measure this include pre- and post-training assessments, quizzes, or skill-based exercises. A big jump in scores from before to after the training is a solid sign that real learning took place.
- Pre-training quizzes give you a crucial baseline of what people knew coming in.
- Post-training tests measure the immediate knowledge boost.
- Skill demonstrations can confirm if participants can actually apply what they learned in a safe, controlled setting.
Sticking with our software rollout example, Level 2 is the quiz a day later asking, "Can you correctly perform the five key tasks we covered?" This confirms if they truly understood the core functions.
Level 3: Behavior
Level 3, Behavior, is where the rubber really meets the road. It asks the most important question: are people applying what they learned back on the job? Learning is great, but it’s just a vanity metric if it doesn't lead to a change in how people work.
Getting this data is trickier. It often involves on-the-job observations, getting feedback from managers, or looking at performance review data. You have to wait weeks or even months after the training to see if the new skills have actually stuck. For our software example, Level 3 is checking in a month later to see: "Are employees using the new advanced features daily, or did they go right back to their old, clunky workflows?"
Level 4: Results
Finally, we arrive at Level 4: Results. This is the holy grail of L&D measurement. It ties your training program directly to tangible business outcomes. Did the training help increase revenue, reduce costs, improve product quality, or boost customer satisfaction?
This level is all about answering the C-suite's biggest question: "What was the return on our investment?" For our software rollout, Level 4 measures the final, bottom-line impact: "Did the new software and associated training reduce average project completion times by 15%?" This directly connects your L&D initiative to a key business metric.
To help put it all together, here is a quick overview of how the four levels stack up.
The Kirkpatrick Model at a Glance
As you can see, each level provides a deeper, more meaningful layer of insight. While you don't need to measure all four levels for every single training program, understanding this progression is key to building a measurement strategy that proves L&D's value.
Essential L&D Metrics and How to Calculate Them
Alright, let's move past the theory and get down to the brass tacks: the actual learning and development metrics you should be tracking. These are the numbers that will tell the real story of your program's impact, helping you shift the conversation about L&D from an expense to a core business driver.
We'll break down the key metrics, complete with simple formulas and real-world examples to show you how they work in practice.

Think of these metrics as different tools in your toolbox. Each one offers a unique perspective on your training's effectiveness, from the moment a learner clicks "start" all the way to the bottom-line financial return.
Measuring Engagement and Completion
Before anyone can learn anything, you first need their attention. That’s where engagement and completion rates come in. These are your foundational, "Are the lights on?" metrics.
A low Completion Rate is a huge red flag. It’s a clear signal that learners are dropping out. The reason could be anything—the content is boring, it's too long, or maybe the platform is just a pain to use. While a high completion rate doesn’t automatically mean learning happened, a low one is a near-guarantee that it didn't.
How to Calculate It:
Completion Rate (%) = (Total Learners Who Completed / Total Learners Enrolled) x 100
For example, if 200 employees sign up for a cybersecurity course and 170 see it through to the end, your completion rate is 85%.
The Engagement Rate goes a step further. It separates the passive clickers from the active participants by looking at actions like posting in forums, asking questions in a live Q&A, or attempting practice exercises.
Tracking Knowledge and Skill Application
So, people are finishing your courses. Great. But did they actually learn anything? And more importantly, are they using those new skills back at their desks?
Knowledge Retention Rate is where the rubber meets the road. It measures how much information actually sticks around weeks or even months later. A perfect score on a quiz taken right after a course is nice, but what really counts is what they remember when it matters.
How to Calculate It:
- Knowledge Gained (%) = ((Post-Test Score - Pre-Test Score) / Pre-Test Score) x 100
- Knowledge Retention (%) = (Follow-Up Test Score / Immediate Post-Test Score) x 100
Imagine a team scores an average of 90% on an assessment right after training. Three months later, you give them a similar test, and they score 72%. Their knowledge retention rate is 80% (72 divided by 90).
Even more telling is the Skill Application Rate. This metric gets you out of the classroom and onto the floor, tracking whether employees are putting their new skills to use in their daily work. This is the all-important bridge between knowing something and actually doing it.
Gauging Efficiency and Business Impact
Now we're getting to the metrics that really make executives sit up and listen. These connect L&D activities directly to the company's performance and financial health.
Time-to-Competency measures how long it takes for an employee—often a new hire—to get fully up to speed and productive in their role. Shrinking this timeline means your training is working efficiently, and it saves the company a significant amount of money by getting people contributing sooner.
Here’s how it plays out:
Let's say a company's new sales reps usually take six months to start hitting their quotas consistently. After you roll out a new, streamlined onboarding program, that time drops to just four months. That two-month acceleration is a powerful testament to your program's success.
Finally, we have the one everyone asks about: Training ROI. This calculation puts a hard number on the financial return of a training program relative to its cost. It directly answers the question, "For every dollar we spent on this, how much did we get back?"
How to Calculate It:
Training ROI (%) = ((Monetary Benefits - Training Costs) / Training Costs) x 100
Let's walk through an example. A company invests $20,000 in an advanced negotiation workshop for its sales team. In the following quarter, the team closes deals that bring in an additional $80,000 in revenue, which they can directly trace back to the skills from the workshop.
- Monetary Benefits: $80,000
- Training Costs: $20,000
- Calculation: (($80,000 - $20,000) / $20,000) x 100 = 300% ROI
A number like 300% is hard to argue with. It provides concrete proof of L&D's value. To build these kinds of compelling stories, it helps to understand the wider world of human resources analytics, which gives you the framework for connecting people-focused initiatives to business outcomes.
By tracking a balanced scorecard of these learning and development metrics, you can paint a complete picture of your program’s health, prove its value with undeniable data, and make smarter decisions to keep getting better.
Improving Metrics with Engaging Video Training
Everyone knows video is a big deal in L&D now, but figuring out if it's actually working is a whole other challenge. Too many teams get hung up on vanity metrics like view counts. A high view count doesn't mean anyone actually learned anything.
To get the real story, you have to dig deeper. Look at metrics that show real engagement—things like average watch time, how many people re-watch tougher sections, and whether they interact with any in-video elements. That’s where you find out if your content is truly connecting.
The Big Roadblock: Quality vs. Speed
The quality of your video content is directly tied to those engagement metrics. And this is where most L&D teams get stuck.
On one side, you've got simple screen recorders like Loom. They're fast and easy, but the raw videos are often 50-100% longer than they need to be. They're full of awkward pauses, "ums," and mistakes that kill learner engagement. People just tune out.
On the other side, there are professional-grade tools like Camtasia or Adobe Premiere Pro. These can produce beautiful, polished videos, but they demand serious video editing skills and a huge time investment. This creates a massive bottleneck, making it impossible to create great video training at the speed your business needs.
Bridging the Gap Between Fast and Good
This is the exact problem we built Tutorial AI to solve. It closes the gap between clunky, raw recordings and the slow, expensive process of professional editing. It’s designed to turn your in-house subject matter experts (SMEs) into confident video creators.
An expert can just hit record, capture their screen, and explain a process naturally. They don't have to worry about a perfect script or nailing every take. They can create anything from detailed software demos and onboarding guides to quick knowledge base articles.
Then, the AI takes over. It automatically analyzes the raw recording and transforms it into a tight, professional video. It’s like having an expert editor on call to trim out all the dead air, tighten up the flow, and make the final cut look like it was made in a pro studio. Your SMEs can create genuinely helpful training content without ever touching a complex timeline.
The whole experience is designed to be intuitive. Anyone can take a simple screen recording and turn it into a valuable learning asset.
As you can see, the platform gives you a simple, text-based script right alongside the visual preview. Making sophisticated edits becomes as straightforward as editing a Word document.
How Better Video Directly Lifts Your L&D Metrics
When you remove the friction from creating high-quality video, you see a direct improvement in the learning and development metrics you care about.
When training videos are clear, concise, and professional, people are far more likely to watch them to the end. That means completion rates and average watch times go up. Better engagement naturally leads to better knowledge retention and, ultimately, better on-the-job performance.
When you add interactive elements to training—something much easier to do with well-edited video—you can boost knowledge retention by an incredible 60% compared to just having people watch passively. It’s not just a nice theory; making people actively participate cements learning and problem-solving skills. Discover more insights about employee training statistics.
By making it easy to create good video, Tutorial AI helps you connect your content creation directly to your core L&D goals. You're not just cranking out videos; you're building a library of genuinely effective learning tools that deliver measurable results.
In the end, the goal is to create content that doesn't just inform but actually sticks. If you're ready to improve your own video strategy, our guide on how to create training videos can show you how to produce content that connects with your team and drives real business impact.
Building Your L&D Dashboard for Strategic Reporting
Collecting learning and development metrics is only one part of the equation. The real win is turning that raw data into a compelling story that actually drives decisions. A well-designed L&D dashboard transforms a pile of numbers into a clear narrative about your program's value, but the story you tell has to change depending on who's in the audience.
Data without a story is just noise. Your job is to build a dashboard that communicates impact, moving beyond simple "who clicked what" tracking to highlight how L&D is moving the needle for the business. That means tailoring the view for each stakeholder.

Customizing Dashboards for Different Audiences
A one-size-fits-all dashboard just doesn't work. The metrics a program manager pores over are the same ones an executive will gloss over. To be effective, you need to provide the right level of detail to the right people.
For the C-Suite: Executives need the 30,000-foot view. Their dashboard should scream "bottom-line impact." You'll want to lead with business-level metrics like Training ROI, Time-to-Competency for new hires, and how that impacts the Cost per Hire. This view answers their biggest question: "Are we getting real value from our L&D investment?"
For Program Managers: This is where you get into the weeds. Program managers need a more granular, operational view to fine-tune their initiatives. Their dashboard should be packed with learner-centric data like Engagement Rates, Completion Rates, and Knowledge Retention scores. These are the numbers that help them figure out what's working and what needs a rethink.
The Art of Data Storytelling
Think of your dashboard less as a data dump and more as a persuasion tool. You’re building a case to secure buy-in, justify your budget, and prove L&D is a strategic partner, not just a cost center. This means drawing a direct line from training activities to business outcomes.
For example, don't just report a high completion rate and call it a day. Connect the dots. Show how a 90% completion rate on a new sales training module was followed by a 15% increase in qualified leads from that team the next quarter. That's a story that gets attention.
Unfortunately, many organizations haven't quite made this leap. A recent Global L&D Benchmark Survey found that 40% of professionals still lean heavily on satisfaction surveys. Far fewer are tracking the tougher stuff—only 21% measure productivity increases and a mere 15% calculate ROI. This reliance on "happy sheets" shows there's still a big gap to close in how we measure our impact. You can see the full report for more on the state of L&D measurement.
Reporting Cadence and Best Practices
To make sure your data actually gets used, you need a consistent rhythm and a few ground rules for reporting.
Key Takeaway: Don't just show the data; interpret it. Every dashboard should come with a summary that explains what the numbers mean, calls out important trends, and recommends what to do next. This turns a static report into a living tool for improvement.
Reporting Best Practices:
- Set a Regular Cadence: Aim for quarterly summaries for executives and more detailed operational reports monthly. Consistency builds trust and keeps L&D on the leadership agenda.
- Use Visuals: Charts and graphs make complex data easy to understand in a single glance. Trend lines are especially powerful for showing progress over time.
- Provide Context: A number by itself is meaningless. Always benchmark it against past performance, goals, or industry standards to show what it really means.
By building tailored dashboards and getting good at data storytelling, you ensure your learning and development metrics are put to work. A key piece of this is automating the data collection, which often means proper integration with your tech stack. To learn more, check out our guide on Learning Management System integration to see how you can streamline your reporting.
Common L&D Measurement Pitfalls and How to Avoid Them
Even with the best intentions, a measurement strategy can get derailed by a few common, predictable traps. Falling into these pitfalls can muddy your data, hide the real impact of your programs, and make it nearly impossible to prove L&D’s value. Knowing what they are ahead of time is half the battle.
One of the most seductive traps is focusing on vanity metrics. It’s easy to get excited about a 95% completion rate on a new compliance course, but what does that number really tell you? Not much. It doesn't tell you if people understood the material, if they can apply it, or if their behavior has changed one bit. It’s like a restaurant bragging about how many people came inside, without mentioning if anyone actually liked the food.
Another classic mistake is data overload. In an effort to be thorough, it’s tempting to track every metric under the sun. This almost always backfires, leading to cluttered dashboards and a severe case of "analysis paralysis." When you're drowning in data, finding a single, meaningful insight feels impossible.
Overcoming Common Measurement Hurdles
A truly effective L&D metrics program is built on purpose, not just possibility. You have to be deliberate about what you track and why. Instead of collecting data for the sake of having it, every metric should help answer a critical business question.
Here are a few practical ways to sidestep these common pitfalls:
Pair Learning Metrics with Business Metrics: To escape the vanity trap, tie every learning metric to a tangible business result. So, you saw high quiz scores after that new customer service training? Great. Now, look for a drop in negative support tickets or an increase in customer satisfaction scores. That's how you connect the dots between learning and real-world impact.
Establish a Baseline First: Don't even think about launching a new training program without measuring performance before it starts. Without that baseline data, you have no reference point. You can't prove your training caused an improvement if you don't know where the team started. It’s like trying to track weight loss without ever stepping on the scale at the beginning.
Don't Ignore Qualitative Feedback: Numbers only ever tell part of the story. The "why" behind your data comes from qualitative feedback—surveys, one-on-one conversations, and manager observations. A low engagement score is just a number until a learner tells you the content felt completely irrelevant to their day-to-day job.
Key Insight: The most effective L&D measurement strategies are selective. They focus on a handful of powerful metrics that are directly wired to the company's strategic goals, rather than trying to boil the ocean. This sharp focus is what delivers clear, actionable insights.
Ultimately, avoiding these pitfalls requires a mental shift: stop measuring activity and start measuring impact. When you focus on the right things—linking learning to business outcomes, setting clear baselines, and actually listening to your people—you build a measurement framework that doesn't just prove your value, but actively helps you get better.
L&D Metrics: Your Questions Answered
We get it. Diving into the world of learning and development metrics can bring up a lot of questions. Let's tackle some of the most common ones we hear from L&D professionals.
How Do I Choose the Right Metrics?
This is the big one. The secret is to stop thinking about L&D metrics and start thinking about business problems. The right metrics are never found on a generic list; they're discovered in conversations with your company's leaders.
What keeps them up at night? Is the sales team struggling to close bigger deals? Then your metrics should zero in on how training impacts sales performance and skill application. Is the engineering department slow to adopt a new framework? You should be tracking things like project cycle times or bug reports. Always let the business needs write your measurement story.
How Can I Create High-Quality Training Videos Without a Full Production Team?
This is a classic dilemma. On one hand, you have simple screen recorders like Loom, which are fast but often result in videos that are 50-100% too long and lose viewer attention. On the other, you have pro-level tools like Camtasia or Adobe Premiere Pro, which are powerful but require a steep learning curve and a ton of editing time.
There’s a much better way. A tool like Tutorial AI lets your subject matter expert (SME) simply hit record and talk through a process. They don't need to be perfect. The AI then automatically edits their raw recording into a polished, professional tutorial that looks like it came straight from a video editor. This makes it incredibly efficient for your experts to create on-brand demos, onboarding walkthroughs, and knowledge base videos without ever touching a timeline.
How Can I Actually Prove the ROI of Soft Skills Training?
Measuring the return on investment for skills like communication or leadership can feel like trying to nail jello to a wall. It’s tough, but definitely not impossible. The key is to shift your focus from a direct, one-to-one financial link to proving a strong correlation with key business outcomes.
Think about it this way: after a communication skills workshop, did you see a measurable drop in project conflicts reported to HR? Did 360-degree feedback scores for managers improve? For your customer-facing teams, did CSAT scores tick upward? By connecting your training to these tangible business indicators, you build a powerful, credible case for the value you’re creating.
Ready to turn your raw screen recordings into polished, professional training videos in minutes? Tutorial AI helps your subject matter experts create amazing content without any editing experience. See how Tutorial AI works and start improving your L&D metrics today.