So, you’ve built a training program. Now comes the real question: did it actually work? Answering that isn’t about guesswork; it’s about a systematic, four-part process. You start by aligning your training with specific business goals, choose a solid measurement model like Kirkpatrick’s, gather the right data, and then analyze it to see the real impact and ROI. This is how you move past simple completion rates and prove the actual value of your learning programs.
Why Measuring Training Effectiveness Matters Now More Than Ever
Companies are funneling huge amounts of money into employee development, but most are flying blind when it comes to results. Globally, the investment is massive—U.S. businesses alone are spending over $80 billion a year. Yet, for all that spending, only about a third of companies actually connect their training programs to financial outcomes. That’s a huge disconnect between investment and proven value.
It’s no surprise that Learning and Development (L&D) teams are under more pressure than ever to justify their budgets. Demonstrating the value of training isn’t just a nice-to-have anymore. It’s a critical function that separates the most successful organizations from the pack.
From Cost Center to Value Driver
When you get measurement right, you fundamentally change how the business sees training—it stops being a cost and starts being a strategic investment. Imagine being able to draw a straight line from a software tutorial to a 15% drop in support tickets, or from a sales training module to a 10% increase in deal size. Suddenly, L&D is a clear engine for growth.
The data backs this up. Research shows that companies that actively measure training effectiveness see average annual employee performance gains of 10%. Those that don’t? They only see gains of 6%. That’s a 67% improvement difference, all from having a solid measurement plan in place.
This is where a structured framework really pays off. The visual below breaks down the core stages you need to follow to build a successful measurement strategy from the ground up.
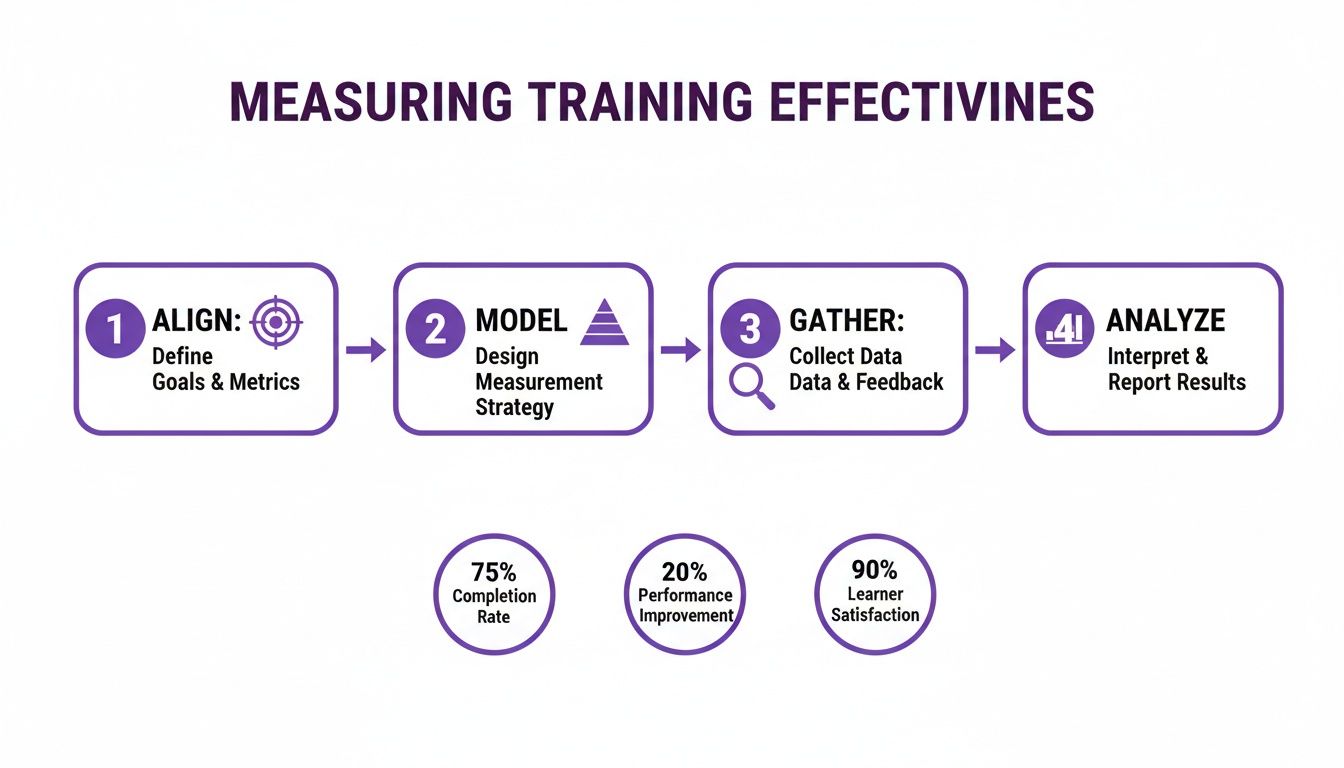
As you can see, it’s a clear path from defining your purpose (Align) all the way to proving your program’s impact (Analyze). It’s a simple but powerful roadmap for any L&D professional looking to make a real difference.
To make this even clearer, here’s a quick breakdown of this framework.
Core Framework for Measuring Training Effectiveness
| Stage | Focus | Key Activity |
|---|---|---|
| Align | Strategy & Objectives | Connecting training goals directly to business outcomes (e.g., increase sales, reduce errors). |
| Model | Measurement & Design | Choosing a framework (like Kirkpatrick) and designing pre/post assessments. |
| Gather | Data Collection | Collecting quantitative and qualitative data (surveys, performance metrics, observations). |
| Analyze | Impact & ROI | Analyzing the data to calculate the training's impact, ROI, and identify improvements. |
This table serves as a handy reference as you begin to build out your own measurement plan.
The Strategic Imperative of Data
Without solid data, you’re just making educated guesses. You might feel like a training program went well, but stakeholders and executives need proof. When you know how to measure training effectiveness, you arm yourself with the evidence you need to:
- Secure Your Budget: Justify current and future spending with hard numbers and concrete ROI data.
- Optimize Your Content: Pinpoint what’s resonating with learners and what’s falling flat, allowing you to iterate and improve. The proper documentation of training efforts is absolutely essential for this.
- Boost Engagement: Show employees exactly how their development contributes to the company’s success, giving them a greater sense of purpose.
- Align with Business Goals: Ensure every single learning initiative you launch is directly supporting a top-level strategic objective.
By adopting a data-driven mindset, you’re not just measuring training—you’re elevating its strategic importance across the entire organization. You turn learning into a predictable, powerful, and respected driver of business success. With that foundation in place, let’s dive into the practical steps, tools, and templates you’ll need to put this framework into action. We’ll start with the most important part: defining objectives that genuinely tie your learning programs to tangible business outcomes.
You can’t measure what you don’t define. That’s the first rule of proving your training’s worth. Vague goals like “improve skills” or “boost communication” sound nice, but they’re impossible to track and do little to connect your hard work to real business outcomes.
So, before you even think about metrics, you have to get crystal clear on what success actually looks like. Think of it this way: you wouldn’t launch a marketing campaign without a specific goal like “increase qualified leads by 20%.” Your training programs need that same level of strategic focus.

Crafting SMART Training Goals
The best way I’ve found to nail down these objectives is with the SMART framework. It’s a classic for a reason—it forces you to move from fuzzy ideas to concrete targets directly tied to the business.
Here’s how it breaks down for training:
- Specific: What exactly do you want to achieve? Don’t say “improve onboarding.” Instead, aim for something like, “reduce the time it takes new support agents to handle their first solo ticket.”
- Measurable: How will you know you’ve succeeded? You need a number, a KPI. This is your proof.
- Achievable: Be realistic. A goal should stretch the team, not break their spirit. An impossible target is just demoralizing.
- Relevant: Does this training actually support a bigger business goal? If you reduce ticket resolution time, will that help boost customer satisfaction scores? It has to matter.
- Time-bound: Give it a deadline. “By the end of Q3” or “within 60 days” creates urgency and gives you a clear finish line for measurement.
A fundamental step in measuring effectiveness is first to establish what success looks like, which involves mastering the art of crafting clear training objectives. This ensures every training initiative has a clear purpose from the very beginning. Using this framework, a weak goal like “better sales skills” transforms into something powerful: “Reduce new sales hire ramp-up time by 15% within Q3 by implementing a new product knowledge training module.” See the difference? Now you have a clear, measurable mission. I’ve found that starting with an employee training plan template can make building out these targeted programs much more straightforward.
Leading vs. Lagging Indicators
As you pick the KPIs for your objectives, it’s useful to think about them in two categories: leading and lagging indicators.
- Leading Indicators: These are the early signs that your training is on the right track. Think quiz scores, course completion rates, or positive feedback surveys. They’re predictive and give you immediate feedback.
- Lagging Indicators: These are the results that show up later and prove the business impact. We’re talking about a drop in customer churn, an increase in sales revenue, or fewer safety incidents on the factory floor.
A truly solid measurement strategy needs both. Leading indicators tell you if people are learning, and lagging indicators confirm that their learning changed their behavior and improved performance.
Real-World Departmental Objectives
Let’s get practical. Here’s what this looks like when you apply it to different teams, moving from the kind of vague goals we all hear to the SMART objectives that actually drive change.
| Department | Vague Goal | SMART Objective |
|---|---|---|
| Customer Support | Improve ticket resolution | Decrease average first-response time by 20% within 60 days of software update training. |
| Sales | Increase product knowledge | Increase the average deal size by 10% in Q4 for reps who complete the advanced features module. |
| Engineering | Better code quality | Reduce the number of bugs reported per feature launch by 25% over the next six months. |
When you set these kinds of sharp, business-aligned goals from the jump, you create a clear roadmap for measurement. You’ll know exactly what data to look for, what success looks like, and how to walk into any stakeholder meeting ready to prove the value of your programs.
Applying The Kirkpatrick Model In The Real World
Once you’ve nailed down your objectives, you need a solid framework to guide your measurement. For decades, the go-to standard has been the Kirkpatrick Four-Level Model. It’s popular for a reason—it gives you a logical path from a learner’s initial reaction all the way to the ultimate impact on the business. Think of it as your roadmap.

While the model is used by 71% of organizations, putting it into practice isn’t always straightforward. In the real world, 87% of companies find it tough to separate the impact of training from all the other things happening in the business. To make matters worse, 82% say their training data lives in a completely different system from their business data, making it a nightmare to connect the dots.
The secret is to not get lost in the theory. Let’s walk through each level with practical examples you can actually use.
The Kirkpatrick Model at a Glance
Before we dive deep, here’s a quick overview of the four levels. This table breaks down what each level measures and some of the most common ways to collect the data you need.
| Level | What It Measures | Common Methods |
|---|---|---|
| Level 1: Reaction | Learner satisfaction and engagement. Did they find the training relevant and useful? | Post-training surveys, feedback forms, quick polls, "happy sheets." |
| Level 2: Learning | The increase in knowledge, skills, and confidence. Did they actually learn what you taught? | Pre/post-assessments, quizzes, skill demonstrations, practical exercises. |
| Level 3: Behavior | The application of learning on the job. Are they doing things differently now? | Manager observations, performance reviews, peer feedback, system usage data. |
| Level 4: Results | The tangible impact on business outcomes. Did the training move the needle on key metrics? | KPI analysis (sales, productivity, retention), ROI calculations, cost-benefit analysis. |
Seeing it laid out like this helps clarify how each level builds on the last, creating a complete picture of your training’s value.
Level 1: Reaction — What Did They Think?
This is your first, and simplest, data point. It’s all about capturing immediate feedback. Did learners find the training engaging? Was the content relevant to their job?
Sure, a happy learner doesn’t automatically mean they learned anything. But it’s a critical first gate. If people hate the training, you can bet they won’t absorb much or try to apply it later.
How to Measure It:
- Post-Training Surveys: As soon as a session ends, send a short survey using tools like Google Forms or SurveyMonkey. A simple 1-5 scale on questions like, “How relevant was this content to your daily work?” works perfectly.
- Pulse Checks: For a multi-day course, don’t wait until the end. Send out quick, one-question polls (“How are you feeling about the pace of this course?”) to get a real-time sentiment check.
Level 2: Learning — What Did They Learn?
Now we get to the good stuff. Did the knowledge actually transfer? This is where you measure the increase in skills, knowledge, or even confidence.
This is the first real test of your instructional design. If your scores are low here, it’s a sign that the content or delivery needs work. If you want to sharpen your skills, exploring these instructional design best practices is a great place to start.
How to Measure It:
- Pre- and Post-Assessments: This is the gold standard for a reason. Give learners a short quiz before the training to get a baseline. Then, give them the same quiz after to measure the knowledge lift.
- Practical Demonstrations: For skills-based training, ask people to actually do the thing. For a software tutorial, have them complete a key task in a test environment. Seeing is believing.
A 25% increase in post-assessment scores over pre-assessment scores is a strong indicator that genuine learning occurred. It moves your measurement beyond satisfaction and into tangible knowledge gain.
Level 3: Behavior — Are They Applying It?
This is where the rubber meets the road. It’s often the hardest level to measure, but it’s arguably the most important. A perfect score on a test is nice, but it means nothing if people go back to their desks and do things the same old way.
How to Measure It:
- Manager Observations: Equip managers with a simple observation checklist to use 30 to 60 days after the training. For example, after a sales training, a manager could track whether reps are using the new discovery questions on their calls.
- Performance Data Analysis: Dig into your systems. After a training on a new CRM feature, are people actually using it? Most software platforms have built-in analytics that can give you a clear yes or no.
Level 4: Results — What Was The Business Impact?
We’ve finally arrived at the bottom line. This level ties everything back to the business objectives you set from the very beginning. Did you reduce costs, increase sales, or improve customer satisfaction?
The big challenge here is isolating the impact of your training. To build a stronger case, try using a control group. Compare the performance of a team that went through the training against a team that didn’t. This helps you confidently say, “Yes, our program made this happen.”
How to Measure It:
- KPI Tracking: Keep a close eye on the specific business metrics your training was meant to improve. If the goal was to reduce customer support tickets, track that metric for a few months before and after the training to see the trend.
- ROI Calculation: For major initiatives, it’s worth calculating the Return on Investment. Add up the total cost of the training (development, delivery, employee time) and compare it to the financial value of the results, like the time saved through new efficiencies.
By working through these four levels, you’re not just collecting data—you’re building a compelling story that shows the true value of learning and development.
Choosing the Right Data Collection Methods and Tools
Once you’ve got your objectives and a framework like Kirkpatrick’s mapped out, it’s time to roll up your sleeves and gather the data. This is where the rubber meets the road—moving from strategy to action. You’ll need to pick the right tools and techniques to collect the quantitative and qualitative insights that will actually tell you if your training is working. The best approach, in my experience, is always a blend; you need different methods to paint a complete picture of your training’s impact.
Think of your data collection strategy like a well-stocked toolkit. You wouldn’t grab a hammer to turn a screw, right? The same logic applies here. The method you choose must fit the specific data you’re after, helping you find solid evidence for each level of the Kirkpatrick model, from gut reactions to bottom-line business results.
Combining Quantitative and Qualitative Data
Truly effective measurement hinges on a mix of hard numbers and human stories. The quantitative data tells you what happened, but it’s the qualitative data that uncovers the crucial why behind it.
- Quantitative Methods: These give you the objective, numerical data that’s easy to analyze and track over time. We’re talking about pre- and post-assessment scores, completion rates, and hard performance metrics like sales figures or support ticket volume. Even survey ratings on a numerical scale fall into this bucket.
- Qualitative Methods: This is where you capture the subjective stuff—opinions, experiences, and context. Think open-ended survey questions, one-on-one chats with trainees and their managers, focus groups, or even just directly observing employees as they try to apply their new skills on the job.
Let’s say your quantitative data shows that post-training quiz scores jumped by 30%. That looks great on a report. But a focus group might reveal that while employees learned the new process perfectly, they’re hitting a wall because of a software limitation. That’s a game-changing insight you would have completely missed by only looking at the numbers.
Modern Tools for Efficient Data Collection
Let’s be honest, manually collecting and crunching all this data can be a massive time-drain. Thankfully, we have modern tools that can automate a huge chunk of this work, delivering richer insights with way less grunt work. This is especially true if you’re creating and measuring the effectiveness of video-based software tutorials.
Think about the classic challenge of creating demos, onboarding videos, explainer videos, feature release videos, knowledge base videos, or support article videos. An expert might fire up a simple screen recorder like Loom. While easy to use, the raw recording is often 50-100% longer than necessary, filled with pauses and mistakes that hurt engagement.
The alternative? Professional video editing software like Camtasia or Adobe Premiere Pro. These tools produce amazing results but require expert video editing knowledge, turning what should be a quick tutorial into a complex, time-consuming project.
Streamlining Video Creation and Measurement With Tutorial AI
This is exactly the problem Tutorial AI was built to solve. Its tools empower subject matter experts to create polished, on-brand video tutorials based on simple screen recordings with incredible efficiency.
Here’s how it works: The expert can speak freely and record their screen without any practice. Tutorial AI takes this raw footage and automatically edits it, so the final video looks professional, as if it was edited in Adobe Premiere Pro. This allows the subject matter expert to create on-brand videos extremely efficiently, removing the bottleneck between knowledge and content creation.
This efficiency is a game-changer for data collection. Instead of spending days on a single video, teams can pump out an entire library of feature release videos or knowledge base content. This lets them gather performance data at a much larger scale. But the real magic for L&D folks is how this ties directly into measuring training effectiveness. Tutorial AI doesn’t just make videos; it provides rich learner analytics that feed right into your measurement strategy. You can track:
- Engagement Rates: See exactly which parts of a video learners watch, re-watch, or skip entirely.
- Comprehension Checks: Embed quick quizzes and knowledge checks right into the video to gauge understanding in the moment.
- Viewer Analytics: See how different teams or roles are interacting with the content, which helps you fine-tune future training.
This data gives you a direct line into Kirkpatrick’s Level 1 (Reaction) and Level 2 (Learning) without having to chase people down for separate surveys or assessments. It’s a seamless way to collect crucial data as part of the learning experience itself. By automating both the creation and the initial measurement, tools like Tutorial AI free up L&D teams to focus on the higher-level analysis: tracking real behavior change and business impact.
Analyzing Your Data to Demonstrate Training ROI
Collecting data is just the starting point. Raw numbers don’t tell a story on their own, and the real magic happens when you start analyzing that information. This is where you turn scattered metrics into a powerful narrative of impact and prove the genuine return on your training investment.

Your first move is a simple comparison: what did things look like before the training versus after? Take the baseline data you gathered and set it against the numbers you collected at the 30, 60, and 90-day marks. This isn’t just about checking for a quick knowledge bump; it’s about seeing if new behaviors stick and actually move the needle on your business KPIs.
To really build a strong case, you need to be confident that the improvements you’re seeing are from the training and not just a fluke. This is where more rigorous analysis comes into play. Methods like hypothesis testing in statistics can help you prove, with statistical confidence, that your program was the cause of the positive change.
Connecting Learning Outcomes to Business KPIs
The analysis has one critical job: to draw a clear line from the learning metrics to the business goals you set out to achieve. If the whole point was to slash customer support response times, you need to show a direct link between the employees who took the training and a drop in that specific KPI.
Start looking for patterns in the data.
- Did the people who scored highest on the post-assessments also show the biggest gains in their on-the-job performance?
- Can you correlate the adoption of a new software feature we taught with a measurable bump in team productivity?
This is where visuals become your best friend. A simple chart showing the “before and after” picture makes the impact immediately obvious to stakeholders. They might not have time to wade through spreadsheets, but they can understand a graph in seconds.
Calculating Your Training ROI
Ultimately, you need to speak the language of the business, and that language is money. Calculating ROI might sound intimidating, but the formula itself is pretty straightforward. It’s all about comparing what you gained to what you spent.
ROI (%) = (Net Program Benefits ÷ Program Costs) x 100 To get to that final number, you just need to figure out both sides of the equation.
Calculating Program Costs: This is the easier part. Just add up every direct and indirect cost you can think of.
- Development Costs: The time your instructional designers and subject matter experts put in.
- Delivery Costs: Any instructor fees, software licenses, or travel expenses.
- Participant Wages: A crucial but often-forgotten cost—the time employees spent in training instead of doing their jobs.
Calculating Net Program Benefits: This is where your analytical skills shine. You need to find the total financial value of the improvements your training created.
- Isolate the Training Impact: Use your data to pin down a specific improvement. Let’s say you saw a 15% reduction in production errors.
- Convert That to Money: What’s that improvement worth? If each error costs the company $50 and your training got rid of 200 errors a month, you’ve created a monthly benefit of $10,000.
- Subtract Your Costs: The net benefit is simply your total monetary gain minus the total program cost.
A Practical ROI Calculation Example
Let’s see how this works with a real-world software training program.
| Metric | Value | Calculation |
|---|---|---|
| Total Program Costs | $20,000 | (Development + Delivery + Wages) |
| Annual Benefit | $60,000 | ($5,000 monthly savings x 12) |
| Net Benefit | $40,000 | ($60,000 Benefit - $20,000 Cost) |
| ROI | 200% | (($40,000 / $20,000) x 100) |
A 200% ROI is a powerful statement. It means that for every single dollar we invested in that training, the company got two dollars back. Numbers like that don’t just justify your budget—they prove that learning and development is a core driver of business success.
Common Questions About Measuring Training
Even with the best framework in place, you’re bound to hit some practical hurdles when you start measuring training effectiveness. Getting ahead of these common questions will help you build a smarter strategy and make sure the data you collect is actually useful.
Let’s dig into a few of the most frequent questions I hear from fellow L&D pros.
How Often Should I Measure Training Effectiveness?
The trick is to think of measurement as an ongoing process, not a one-and-done event. To get the full story, you need to collect data at different points in time to see how your program’s impact evolves from initial reactions to long-term business results.
A staggered approach usually works best. Here’s a timeline that has proven effective for many teams:
- Immediately After Training: This is your chance to capture Level 1 reaction data. Get those feedback forms out right away while the experience is still fresh.
- Within One Week: Now’s the time to check for Level 2 knowledge retention. A simple post-training quiz can tell you what actually stuck.
- 30-90 Days Post-Training: This is the magic window for spotting real change. Look for Level 3 behavior shifts on the job and start tracking early indicators of Level 4 business impact.
- Ongoing: For evergreen programs like new hire onboarding, you should be monitoring key performance indicators constantly. This is how you spot long-term trends and understand the program’s cumulative value.
What If My Training Shows No Measurable Impact?
First off, don’t panic. A flat line on your dashboard isn’t a failure—it’s a diagnostic tool. It’s valuable data telling you that something in the chain is broken and needs fixing.
If your metrics aren’t moving, start by investigating these areas:
- Revisit Your Objectives: Were the goals you set truly aligned with a critical business need? This is the most common reason for a lack of impact. If the training doesn’t solve a real problem, it won’t produce a real result.
- Analyze the Training Content: Was the material genuinely relevant to what your team does every day? Was it engaging? Sift through participant feedback for clues.
- Examine the Post-Training Environment: This one is huge. Are managers actually coaching and reinforcing the new skills? Without support from leadership, even the best training will wither on the vine.
A lack of impact almost always points to a breakdown in one of these three areas. Your data provides the clues you need to pinpoint the problem and make targeted improvements.
How Can I Create Better Video Tutorials More Efficiently?
This is a pain point for so many teams. You need high-quality software tutorials for demos, onboarding, or support articles, but your options seem limited. Quick-and-dirty screen recordings with tools like Loom are fast, but they often end up being 50-100% longer than necessary, which absolutely kills engagement.
On the other end of the spectrum, professional tools like Camtasia or Adobe Premiere Pro give you a polished result, but they require serious video editing skills and a huge time investment.
This is exactly the problem Tutorial AI was built to solve. It allows a subject matter expert to just hit record and talk through their workflow, mistakes and all. The AI then automatically edits the footage, cutting out ums, ahs, and long pauses, making the final video look like it was professionally produced. It’s an incredibly efficient way to create polished explainer videos, feature announcements, and knowledge base tutorials without needing a video editor.
What Is The Difference Between Training Effectiveness and Efficiency?
This is a critical distinction, and getting it right can change how you think about your entire L&D function.
- Training Efficiency is all about your inputs and resources. It asks, “How much did this cost per person?” or “What was our completion rate?” It’s focused on doing things right.
- Training Effectiveness is all about the outcome. It asks, “Did we actually change behavior and achieve our business goal?” This is about doing the right things.
While efficiency metrics are important for managing your budget, they’re meaningless if the program itself isn’t effective. You can have the most cost-efficient training in the world, but if it doesn’t move the needle on performance, it’s a waste of money. Always solve for effectiveness first, then look for ways to make your delivery more efficient.
Ready to create studio-quality training videos and demos with unmatched efficiency? Tutorial AI turns your raw screen recordings into polished, professional tutorials in minutes, not hours. See how it works and start creating better content today at tutorial.ai.